Inflation Analysis — 2024
The recent April CPI inflation report showed inflation staying firm at a 3.5% annualized rate and has sent equities and other risk assets tumbling downwards. Bond yields have shot up, and traders are now revising their forecasts downward from 6 interest rate cuts this year (reduce the FFR by 1.5%) to 2 rate cuts (reduce the FFR by 0.5%). The primary macro risk we see at Dionysian is the risk that a persistent labor market imbalance will keep inflation elevated and that amidst a surprisingly strong economy and labor market, the Federal Reserve will be reluctant to cut rates at all through 2025. To assess this risk, this post dives into some of the various components of the PCE and CPI indices, their relative impact on overall inflation, and where those components might be headed.
Goods Inflation
Core inflation for both PCE and CPI is generally broken down into three primary components: goods, housing services, and non-housing services (NHS).
The first component in this basket, goods inflation, measures the price changes for both durable (appliances, furniture, electronics, vehicles etc.) and nondurable (food, fuel, clothing, etc.) goods. Goods inflation peaked in early 2022 at about 7.5% annualized, and it was the first of the components to materially slow down in response to tighter monetary policy. Since then, goods prices in February are actually 0.5% below their levels from a year ago.
Source: White House Council of Economic Advisers
During the early stages of the pandemic, many people in the US started spending more and more time at home, so consumers increased their spending on goods relative to services, especially through online shopping. As the world slowly transitioned back to in-person consumption, we saw a shift back to spending on services, which has caused aggregate demand for goods to fall. On top of this shift in consumer behavior, monetary policy has lowered overall liquidity and therefore aggregate demand, which has led first to a decrease in commodity prices and then to a price decrease in a broad basket of goods. On the supply side, supply chain issues, which contributed so much to increasing prices of raw materials during 2020-2021, have largely been resolved since the COVID crisis. Most economists agree that the disinflationary trend in goods is very clear and that there remains relatively little risk of a significant rebound in goods inflation.
Housing Services Inflation
Housing inflation has remained stickier than goods inflation and has been responsible for a disproportionate amount of total core inflation in recent months. However, it’s well known that housing inflation as reported in the CPI and PCE lags changes in the housing market.
On a 6-month basis, housing inflation peaked at almost 9 percent in January of last year before reversing course. The most recent CPI report showed housing costs up 0.4 percent in February, down from 0.5 percent in January. The figure below shows that housing inflation is significantly down from its peak but remains elevated relative to its pre-pandemic average.

Source: White House Council of Economic Advisers
In general, housing inflation, as reflected in CPI and PCE, has refused to come down nearly as quickly as goods inflation.
As expected, the demand side of the housing market is especially responsive to monetary policy, a very effective lever in decreasing the number and dollar volume of home purchases. On the supply side however, with mortgage rates at multi-decade highs, housing supply is at a record low. Many existing homeowners are comfortably sitting on ultra-low pandemic-era mortgage rates, refusing to sell except at high prices. Housing prices are being pushed up, not because buyers are buying but because sellers aren’t selling. This is an important distinction because a demand-led housing price increase would indicate that liquidity from the pandemic stimulus is still strong, which could mean continued higher spending in other areas of the economy. Substantially decreased rates of selling tell a different picture, one in which homeowners are refusing to sell because the alternative (taking out a new mortgage) is too expensive. While housing prices may not meaningfully decline from current levels, without the demand-side pressures of increasing wealth and liquidity, reduced inventory most likely won’t lead to persistent, high levels of housing inflation.
CPI Shelter Lags the Housing Market
More importantly though, the CPI and PCE shelter indices don’t actually reflect the underlying present economic reality of the housing market, since there exists a substantial lag between prices reflected in CPI/PCE shelter and current housing market prices.
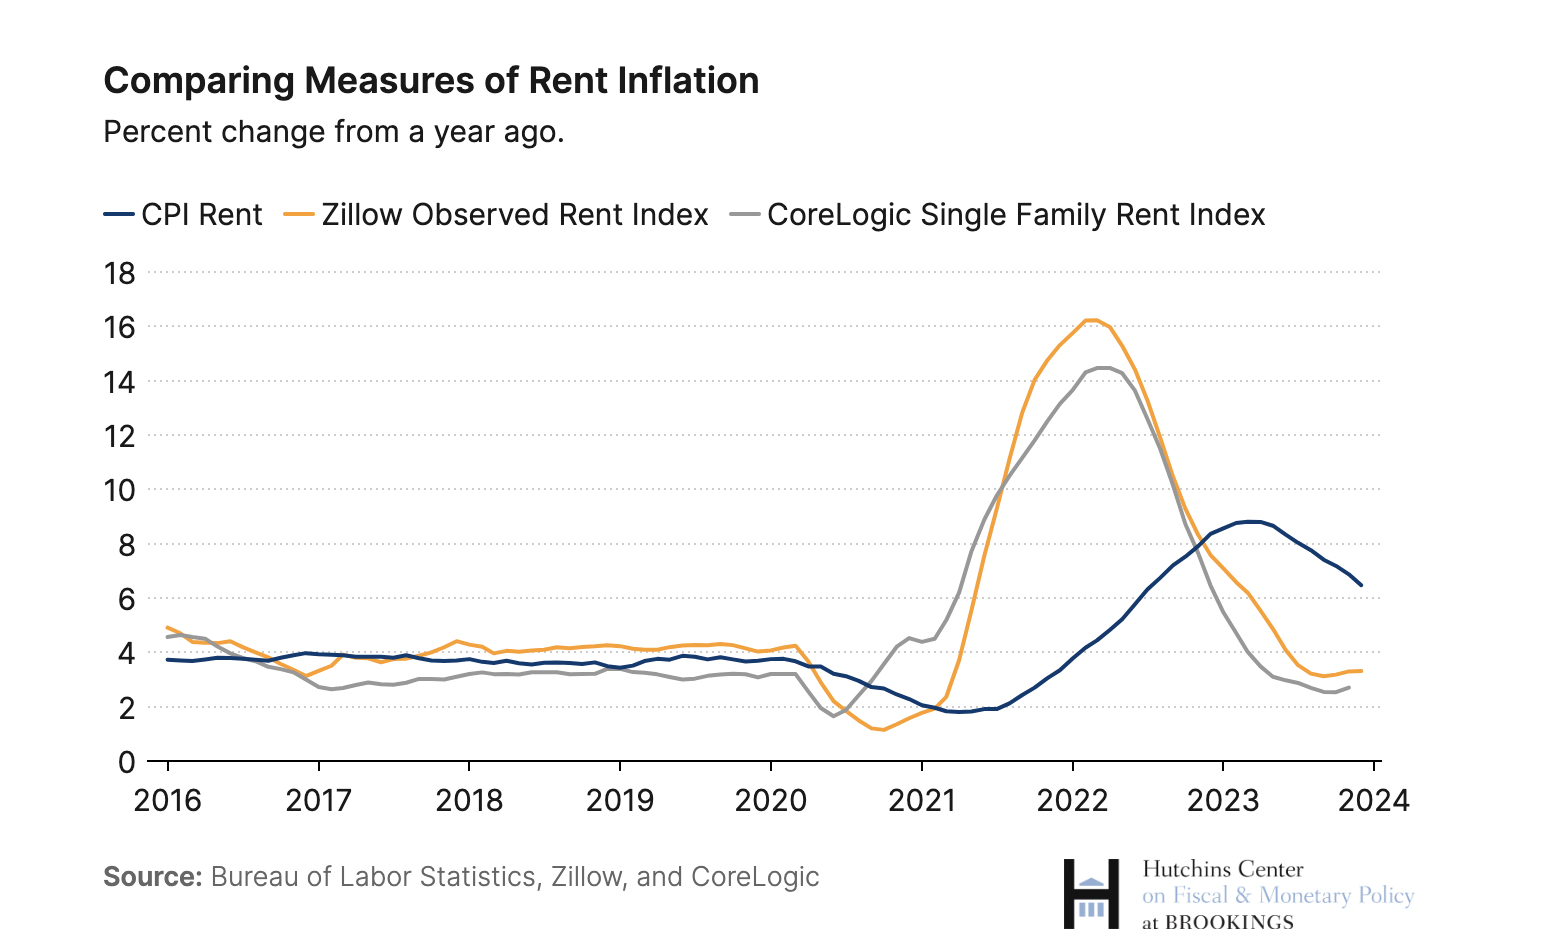
Source: Brookings Institution
For instance, there's a considerable lag between the changes in the CPI shelter index and the Zillow Observed Rent Index (ZORI), a repeat-rent index that is weighted to represent observed market rent across the whole market.
CPI shelter also lags House Price Growth, which has also come down significantly since 2022:

Source: Brookings Institution
The ZORI peaked in early 2022, soon after the Federal Reserve started hiking interest rates; however, the CPI shelter measure didn't peak until early 2023. The difference can be found in the way that these two indexes actually measure shelter prices.
CPI calculations for shelter are broken down into two categories: rent and owner's equivalent rent (OER), a measure that approximates the amount it would cost to rent an owner-occupied home in the current market. In order to actually collect data on rent, the Bureau of Labor Statistics (BLS) either conducts in-person visits or makes telephone calls to about 40,000 residences1. These residences are broken down into 6 different panels, and each panel is surveyed every six months in staggering intervals. For example, panel 1 is surveyed January and July1, panel 2 is surveyed in February and August, panel 3 is surveyed in March and September, so on and so forth. The CPI methodology assumes that rents don't change very much in a period of 6 months (an assumption that usually holds true but was not necessarily the case during the inflationary post-COVID era).
The BLS only samples its limited dataset every 6 months and assumes a gradual, linear change between the two periods. So when the CPI reports housing price changes "per month", what we're actually seeing is the price difference between now and 6 months ago in rents for specific panels, averaged linearly over those 6 months (those numbers are then fed into a regression model). There are two key factors in this methodology that lead to lags in the reported data:
First, the CPI mostly ignores rents for units currently being listed on the market; it only records rents for units occupied by continuing renters1. Any changes in rent will only get picked up in the CPI when leases expire, typically one year or more. The ZORI, on the other hand, captures market rents for both units occupied by continuing renters and for units currently listed for rent.
Second, the method of assuming linear price changes works fairly well when inflation is steady, but when the rate of price changes is rapidly changing, 6-month averages can be a poor proxy for recent trends. Because the rate of increase in rental prices has been dropping significantly, it's likely that housing inflation in recent months is lower than the average measured across those 6 months. Put another way, “[t]hat means that an unusual increase [or decrease] in rents will only fully show through with a lag in the CPI.”1
The result of these two factors is that the shelter index lags market rents by approximately 12 months: "Similar to a recent Bureau of Labor Statistics paper (Adams et al. 2022), CEA finds that it takes roughly 12 months for changes in market rents to become fully incorporated into housing CPI"2
This means that the decline in the ZORI from Q1 2023 to the present has yet to be incorporated in the CPI (from nearly 6% YoY increase down to 3% YoY increase)—quite a significant change in the housing market.
Shelter vs. Everything Else

Source: Brookings Institution
The above graph shows how important shelter is in calculating overall price changes in the CPI. All items less shelter peaked in early 2022 and has since stabilized at or slightly below 2% annualized. Meanwhile, shelter costs as measured by the CPI have remained very high and are disproportionately accounting for the reported elevated inflation numbers. Get rid of shelter from the CPI index and we’re already at 2% inflation.
And that shelter portion of the CPI index tends to lag real changes in the housing market. More reliable measures of real-time housing prices such as the ZORI and ZHVI (Zillow Home Value Index) provide evidence that both rent and house prices are significantly cooling, prices which are leading indicators for future CPI and PCE reports.
PCE vs CPI
Housing is heavily weighted in the CPI, accounting for over a third of the total index and around 45 percent of the core index. However, housing is only 16 percent of headline PCE and 18 percent of core PCE. The recent CPI report showed 3.5% annualized inflation, while the most recent PCE release (the Fed's preferred gauge of inflation) showed only a 2.7% increase in inflation from a year ago. While there are a number of key differences between the two indexes, the difference in weights assigned to housing is a very crucial difference and one that could lead to inflating the CPI numbers relative to the PCE numbers. Ultimately, the Fed wants to see the PCE index at 2% annualized inflation, regardless of what the CPI shows.
Non-Housing Services Inflation
The last category, non-housing services (NHS) inflation, captures everything else. Assuming that housing inflation is in fact coming down but current inflation data is simply lagging that trend, then NHS is the last major obstacle between the Fed and its 2% inflation target. NHS inflation peaked at 8% around mid 2022 and bottomed out a little under 3% in mid 2023. But since then, NHS inflation has accelerated again to roughly 6% in early 2024. The primary input to NHS inflation is thought to be wage growth, and the labor market has been the stickiest component of inflation and the one that has been the least responsive to monetary policy changes. We see labor market imbalances as the primary risk to inflation continuing longer than the market expects; any persistent structural dislocations in the labor market could lead to sustained wage growth and therefore continued NHS inflation for the next year, or even longer. Goods inflation is down, housing is coming down (even with substantial lags in the data), so why has NHS inflation been on the rise in the past half year? Is the labor market still severely imbalanced?
How important is the Labor Market?
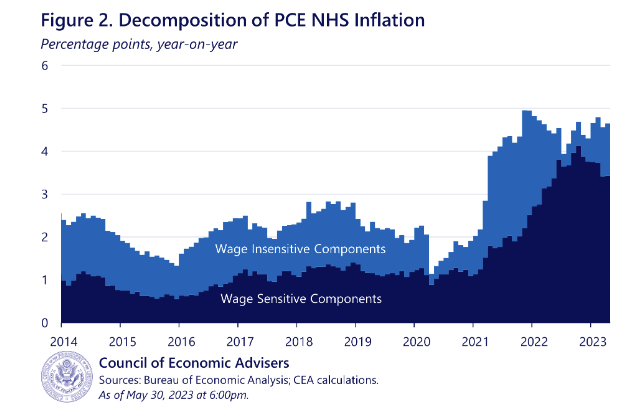
The first question is: how important is wage growth to NHS inflation? According to a blog post written by the White House Council of Economic Advisors (CEA) on May 31, 2023 that disaggregates the various components of NHS Inflation, wage-sensitive parts of sectors are responsible for 43% of "excess" annual core inflation and the vast majority of NHS inflation2.
Source: White House Council of Economic Advisrs
"Moreover, while the level of NHS inflation as shown in Figure 2 is still seeing positive contributions from both wage-sensitive and -insensitive components as of April, the rise in NHS inflation relative to prepandemic norms is now entirely driven by its wage-sensitive components. And when looking at core overall, wage-sensitive NHS is now a bigger contributor to excess core inflation than housing or core goods."2
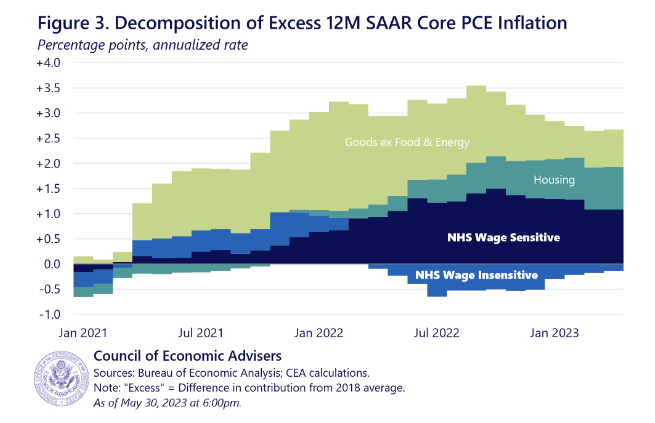
Keep in mind two things here. Housing is given a lower weight in the PCE as compared to the CPI— 18% of core inflation vs. 45% respectively, so wage-sensitive NHS and NHS in general are more likely to have a higher relative impact on PCE core inflation, just by design. Secondly, “excess core inflation” is defined as the components’ additional inflation relative to their 2018 averages, which isn’t the same as saying NHS Wage Sensitive components contribute more on an absolute basis to current core inflation than Housing and Goods.
Source: White House Council of Economic Advisers
Still, by either metric, NHS wage sensitive components are clearly a very important part of core PCE inflation. The diagram above shows a decomposition of core PCE inflation into the categories of "Goods ex Food and Energy”, “Housing”, “NHS Wage Sensitive”, and “NHS Wage Insensitive”. As we can see, NHS wage sensitive inflation started increasing after Goods inflation but since late 2022 has become the largest component of core inflation.
The Labor Market Imbalance
So wage sensitive sectors have been disproportionately responsible for core inflation from mid 2022-2023 and for the vast majority of NHS inflation. How did we get here?
Unique consequences of the COVID Pandemic sharply reduced labor supply while unprecedented fiscal and monetary stimulus drastically increased labor demand, and this imbalance led to significant wage growth. The Phillips Curve captures this intuitive idea about the labor market: wage gains represent an imbalance between the supply of workers and the demand for workers. The wage Phillips Curve in particular represents the relationship between wage growth and unemployment: as unemployment decreases, the supply of available workers to replace existing workers decreases, and the ability of existing workers to command higher wages increases.

We can look at total non-farm job openings as a reasonable proxy for labor market demand. As the graph above demonstrates, there was a sharp drop in job openings in 2020 followed by a dramatic rise from 2020 to early 2022. During that period the Federal Reserve flooded the economy with emergency lending, loose monetary policy, and easy liquidity, and the U.S. government also injected massive amounts of fiscal stimulus, in the form of direct cash payments, government spending and investment, tax credits, and lending programs. The result was massive consumer spending, a roaring economy, and a rapid increase in hiring. Since the Federal Reserve started hiking interest rates in early 2022 however, we can see a very clear downtrend in the number of job openings.

Note. From the White House Council of Economic Advisors, The Employment Situation in March 2024: Rinse and repeat! A Virtuous Cycle in the Job Market (https://www.whitehouse.gov/cea/written-materials/2024/04/05/the-employment-situation-in-march-2024/)
Meanwhile, on the supply side, the US experienced a historically low labor force participation rate—defined as the percentage of the civilian noninstitutional population that is either working or actively looking for work— during 2020-2021. The reduced supply of labor was due to numerous COVID-related factors: the US experienced much lower levels of immigration; people delayed finding employment due to generous stimulus checks and high savings rates; older generations experienced both higher rates of mortality and early retirement due to COVID risk; and many prime-age workers stayed out of the labor force due to health and family-care concerns. Many of these factors have since normalized since the onset of the pandemic, thus boosting the current labor force participation rate past its 2019 pre-pandemic levels.

The Jobs-Worker Gap
Source: https://fred.stlouisfed.org
The above Jobs-Worker Gap, defined as the difference (total nonfarm job openings + employment) - civilian labor force, visualizes the level of supply/demand imbalance in the labor market. As the graph shows, there was a large surplus of labor force workers above the level of available job openings and employment for most of the first two decades of the 2000s. That gap increased significantly during the '08 financial crisis, putting downward pressure on wage growth for most of the early 2010's. That gap also dropped sharply during COVID but since then has rebounded to produce an unprecedented surplus in job openings relative to labor force levels. As mentioned above, this is due to the dual effect of a massive increase in job openings combined with a sharply depressed level of labor force participation during the early COVID years.
The highest gap occurred during March 2022, when there were roughly 6 million more job openings than people in the labor force, which coincides with the peak of job openings available. Since then, job openings have come down and labor force participation has increased, and therefore the gap has continued to decrease to where it currently stands at around 2 million. This gap still far exceeds historical levels from 2000 to 2018, during which there existed a significant deficit of job openings relative to workers.
While there is still a moderately sized Job-Worker Gap, the above graphs show substantial evidence that labor market supply has been increasing back to normal levels, labor market demand has been decreasing, and the gap between the two has been getting narrower, which should slow down wage gains and therefore reduce NHS wage-sensitive inflation.
Wage Gains Lag Core Inflation
Ultimately, the labor market metric the Fed cares about is wage growth. Wage gains are a primary input into many non-housing related services, and if wage gains continue at their recent post-pandemic rate, the economy will have a difficult time getting back to the Fed’s target 2% inflation level.

Source: White House Council of Economic Advisers
Annualized wage gains right now are hovering a bit above 4%, down from its peak in March 2022 of 6%. The Federal Reserve has said that annual wage growth of 3.5% is consistent with their target of 2% inflation. While wage growth hasn't decelerated quite as fast as inflation has, it is steadily decreasing and only 50bps above the Fed's target. The current progress shows that the labor market—and wage growth in particular— is on the right track for 2% inflation.
But there’s another reason to be optimistic: wage gains lag price gains. In general, wages are slower to adjust than prices3, and inflation in wage-sensitive sectors tends to lag wage growth: "We estimate that, on average, price inflation in wage-sensitive NHS categories lags wage growth in those same categories by 10 months"3. Therefore, the effects of decreased wage gains on inflation in wage-sensitive sectors could realistically be lagging core inflation by over a year. With these lags in mind, "waiting until the growth in unit labor costs has subsided to determine that inflationary pressures have abated runs the risk of missing when inflationary pressures actually eased."5 It's fairly likely that these wage-related inflationary pressures have already eased but that easing has yet to show up in current inflation reports.
Excess Savings
Fiscal stimulus, monetary stimulus, and booming asset markets, such as equity and real estate markets, combined with shelter-at-home policies and reduced opportunities to spend income in person all sharply increased U.S. consumers' accumulated excess savings during the pandemic. Shortly after the start of the post-COVID reopening, we saw a consistent drawdown in cumulative excess savings, as consumers were eager to go back into the world and spend money on leisure, travel, entertainment, etc., buoyed by the additional cash and asset cushion they built up during the pandemic. Since then, consumer spending fueled by this pool of excess savings has been incredibly resilient in the face of interest rate hikes, driving economic growth and fueling inflation for longer than most have anticipated.

Source: Federal Reserve Bank of San Francisco
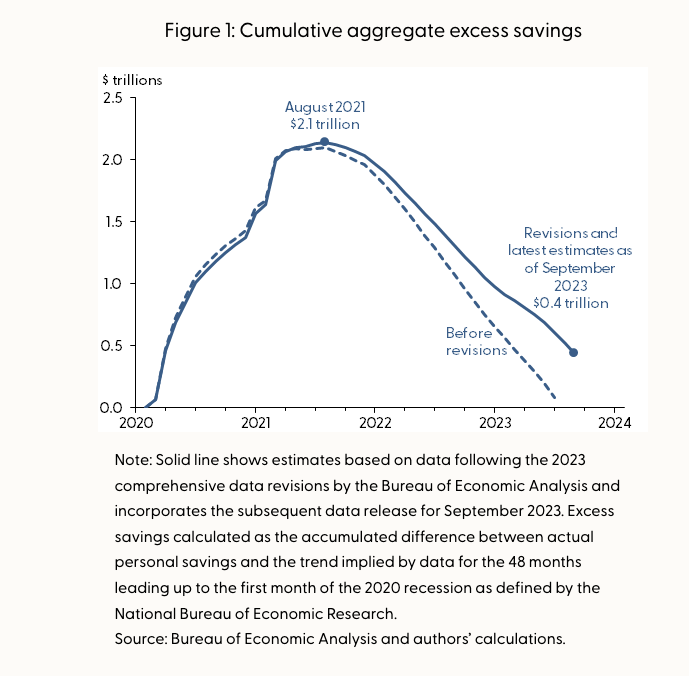
Source: Federal Reserve Bank of San Francisco
Importantly, as the graphs above depict, cumulative aggregate excess savings has been consistently decreasing since August 2021 and has come close to being completely drained. If excess savings hits 0, or if spending significantly decreases as a result of the low consumer savings cushion, a large source of consumer spending will be removed from the U.S. economy, which should further drive the disinflationary trend.
Conclusion
All three components of core inflation —goods, housing services, and non-housing services— are trending in the right direction.
Goods inflation, due to lower aggregate demand and liquidity and a normalized supply chain, has fallen rapidly and is staying at low levels.
Housing services inflation is still elevated; however, more reliable real-time indicators of the housing market show significant cooling in both rental and housing prices. Furthermore, the substantial lag between housing prices and the shelter index for both the CPI and PCE indicate that much of the current housing services disinflation has yet to be reflected in monthly inflation numbers.
While the labor market does need additional rebalancing/normalization to be consistent with the Fed's 2% inflation target, 1) we do see that rebalancing occurring, 2) the rate of wage gains is steadily decreasing, and 3) the impact of this trend on wage sensitive NHS inflation lags price changes by over a year, meaning that current readings of NHS inflation may not be indicative of the current state of disinflation. Overall, our view is that the labor market is properly rebalancing in line with 2% inflation, and we do not see out any outsized risk that continued pressure from a tight labor market may sustain elevated inflation for over a year—or even worse, that it may cause a wage-price spiral. Therefore, we see this as an opportune time to invest in risk assets, with a low probability that inflation will remain elevated over a year from now.
Our Investment Philosophy
All in all, at Dionysian, we're not in the business of looking at market expectations of the exact path of rate cuts and developing a thesis on whether there will be 1, 2, 3, or 6 rate cuts by the end of the year. We look at macro conditions to consider where we are in the overall liquidity cycle (as well as associated changes in the discount rate) and use that as an opportunity to forecast additional growth and to take advantage of the prices that Mr. Market hands us.
This year, traders have forecasted as many as 6 rate cuts and as few as 1. In the short term, bond yields and risk asset prices may move up or down, as traders react and over-react to monthly headline inflation numbers. Over the long term, however, inflation in the economy will move in accordance with larger, structural forces that are not shaped by random chance but rather by the decisions of institutions, such as the Federal Reserve, and the conditions of macroeconomic activity in our country, such as the labor market. We’re not interested in playing a game of Liar’s Poker, of anticipating how other market participants will interpret complex and sometimes misleading economic indicators. Instead, we look to the future and, through comprehensive analysis, try to determine longer-term economic trends and position ourselves appropriately.
The evidence suggests that disinflationary forces are making good progress and are on track to achieve 2% inflation. Some quirks in how these metrics are accounted for in our country’s archaic economic reporting methods (rent data is measured by surveying 40,000 residences!) may skew those numbers in a way that may not be representative of the underlying economic reality. And ultimately the underlying reality is this: aggregate demand is coming down, excess savings is coming down, the housing market is cooling, and the labor market is rebalancing. While there may be some more bumps along the way in the form of fluctuations in the price of oil, health insurance, etc., over the long-term inflation will come down, the Fed will cut interest rates, liquidity will increase, and investment in risk assets will rise.
Sources
[1] “How does the Consumer Price Index account for the cost of housing?”, Brookings Institution, January 31, 2024, Alexander Conner, Sophia Campbell, Louise Sheiner, and David Wessel. https://www.brookings.edu/articles/how-does-the-consumer-price-index-account-for-the-cost-of-housing
[2] “An Update on Housing Inflation in the Consumer Price Index”, White House Council of Economic Advisers, April 27, 2023. https://www.whitehouse.gov/cea/written-materials/2023/04/27/update-on-housing-inflation-in-cpi/
[3] “Wage Sensitivity in Non-Housing Services Inflation”, White House Council of Economic Advisers, May 31, 2023. https://www.whitehouse.gov/cea/written-materials/2023/05/31/nhs-wage-sensitivity/
[4] “An Update on Non-Housing Services Inflation”, White House Council of Economic Advisers, March 22, 2024. https://www.whitehouse.gov/cea/written-materials/2024/03/22/an-update-on-non-housing-services-inflation/
[5] "Unit labor costs and inflation in the non-housing service sector", Chicago Fed Letter, March 2023, Number 477, Gadi Barlevy, senior economist and economic advisor, and Louijia Hu, senior economist and economic advisor. https://www.chicagofed.org/publications/chicago-fed-letter/2023/477
[6] “Data Revisions and Pandemic-Era Excess Savings”, Federal Reserve Bank of San Francisco, November 8, 2023, Hamza Abdelrahman and Luiz Edgard Oliveira. https://www.frbsf.org/research-and-insights/blog/sf-fed-blog/2023/11/08/data-revisions-and-pandemic-era-excess-savings/#:~:text=Our%20updated%20estimates%20suggest%20that,Pandemic%2DEra%20Excess%20Savings.%E2%80%9D
[7] “How Much Do Labor Costs Drive Inflation?”, Federal Reserve Bank of San Francisco, May 30, 2023, Adam Hale Shapiro. https://www.frbsf.org/research-and-insights/publications/economic-letter/2023/05/how-much-do-labor-costs-drive-inflation/